Lighthouse says green.
Google sees red.
A lab test simulates one visit. Google ranks on what real Chrome users experience. TamRank shows both numbers side by side, inside WP admin.
What's in the monitor
Three parts, all PRO.
PageSpeed Monitor
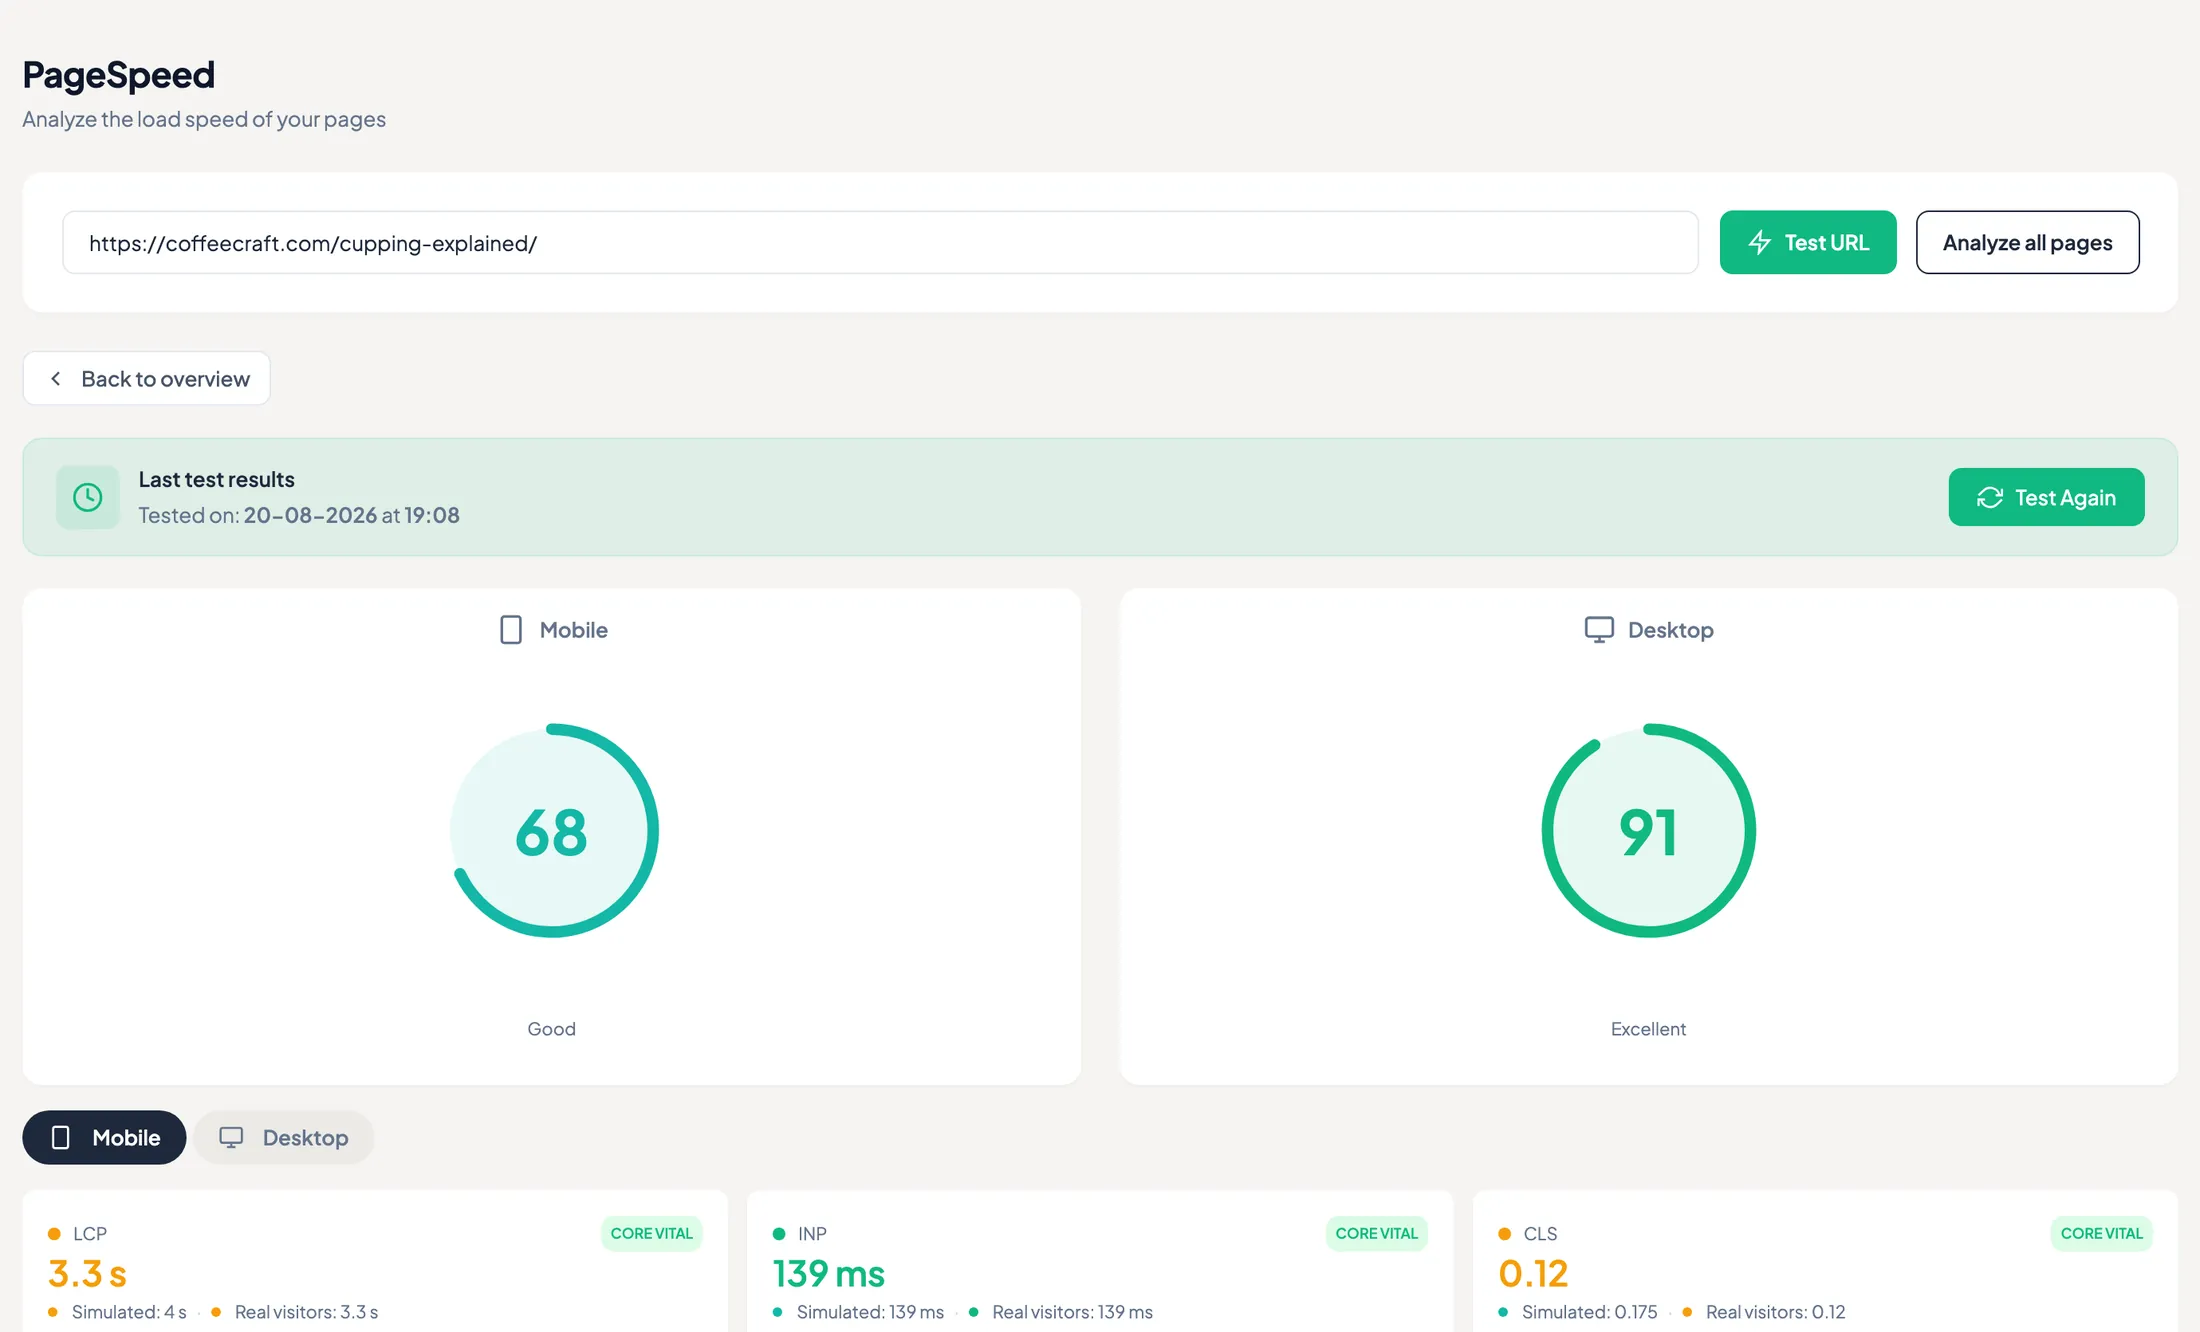
Desktop and mobile via Google PageSpeed Insights, inside WP admin. LCP, INP and CLS per page.
PROCrUX Real User Data
Field data from real Chrome users next to your lab score, with the good / needs improvement / poor distribution and p50, p75 and p95 percentiles.
PROBulk PageSpeed Scan
Test all pages at once and export the results.
PRO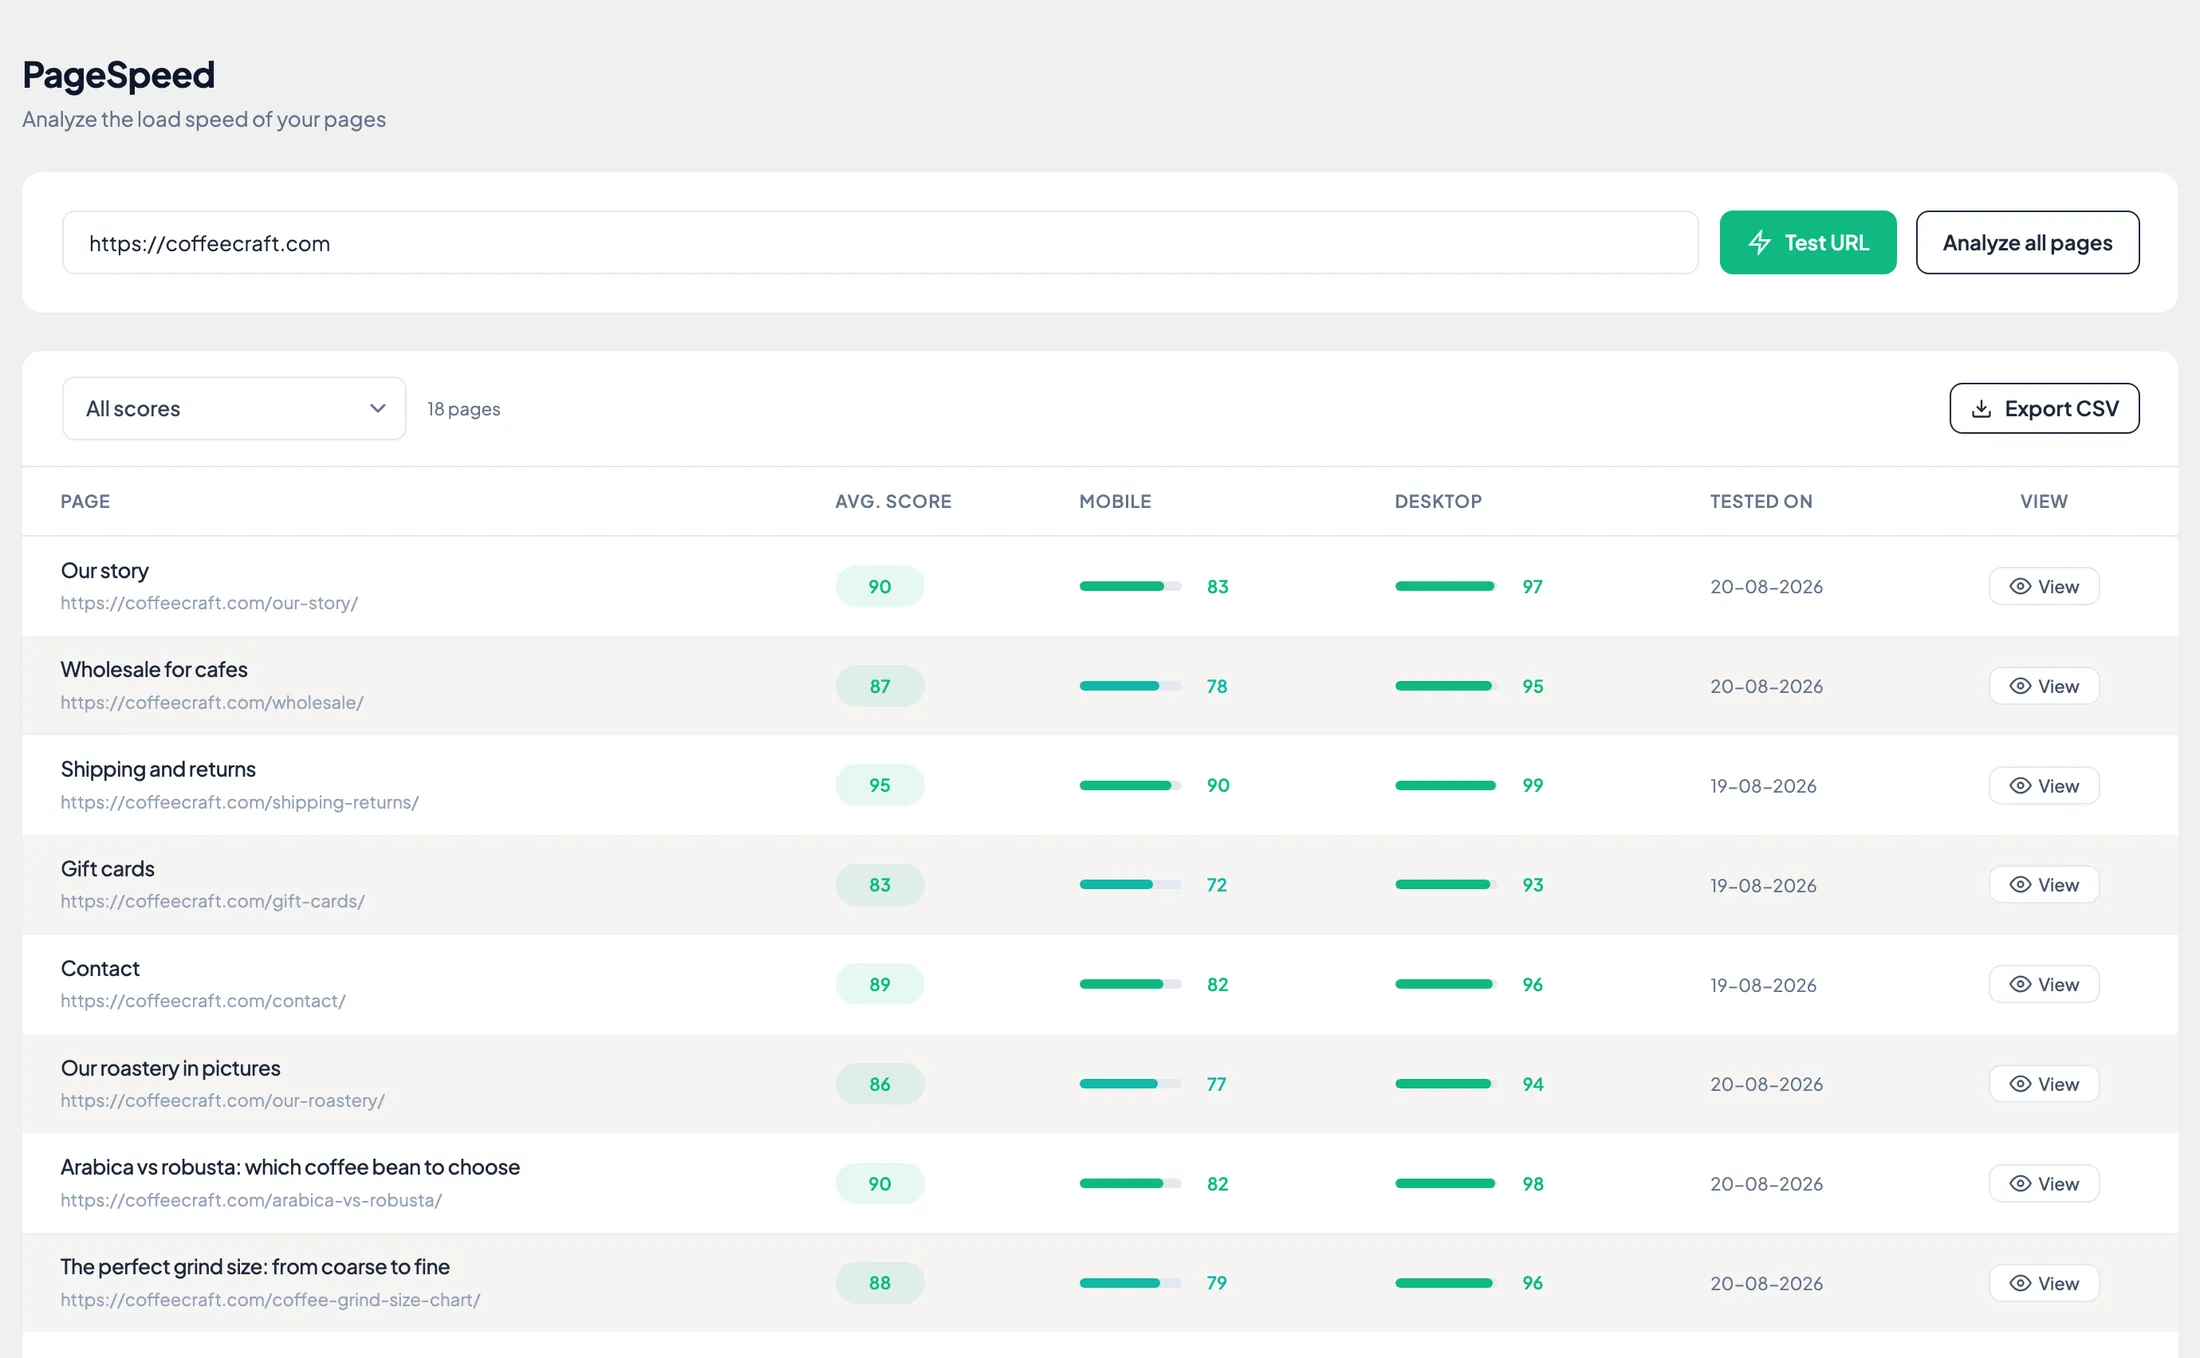
Field data · CrUX
The number Google actually uses.
Field data is collected from real Chrome users over a rolling 28-day window. Google evaluates the p75 value: if p75 is poor, a perfect lab score will not change the signal.
Half of your visitors are fine. The slowest quarter is what Google grades you on.
When you'll reach for it
A client says the site feels slow, but your lab score is 95
Their phones disagree with your test rig. Field data settles it with real visitor numbers, per page.
Search Console flags CWV issues you can't reproduce
The issue lives in the field distribution, not in your lab run. Check the poor bucket and the p75 value for that URL.
You run a performance sprint and need a before and after
Bulk-scan every page, export, fix, scan again. The delta is your report.
How this compares
Both numbers, in one place.
Most WordPress SEO plugins stop at a lab score, if they measure speed at all.
PageSpeed Monitor is one piece of TamRank PRO.
What's included
PROPriority Actions
Impact-ordered fixes
SEO Change Tracker
A log per change
Page Insights
Per-page GSC queries
Position Stability
Solid or shaky, per keyword
REST API write + batch
30 writes/min, 50 per batch
AI assistant integration
Your assistant runs TamRank
See everything included in TamRank PRO.
Frequently asked questions
Where does the field data come from?
From the Chrome UX Report (CrUX): anonymized performance data from real Chrome users, aggregated by Google over a rolling 28-day window.
Why do my lab and field numbers differ?
A lab test runs once, on one simulated device and network. Field data covers every real visitor, on slow phones and fast fiber alike. Both are true, they answer different questions.
My page has little traffic. Is there field data at all?
If a URL has too few samples, TamRank falls back to origin-level field data, so you still see how your site performs for real users.
Which metrics are tracked?
The current Core Web Vitals: LCP, INP and CLS, for desktop and mobile.
Does the monitor slow down my site?
No. Tests run through Google's PageSpeed Insights API. Nothing is injected into your visitors' pages.
See what Google sees.
Lab and field data for every page, inside WP admin. Part of TamRank PRO.

